Agricultural Land Use and Domestic Well Contamination in California
View the Interactive Story Map
Research Question
How is groundwater quality for domestic users affected by proximity to, and scale of, agricultural and ranching operations in California?
Data Sources
| Name | Source | Year | Link | Data Format | Attributes/Fields | Description |
|---|---|---|---|---|---|---|
| GAMA Groundwater Info | USGS Priority Basin Project | 2023 | GAMA Groundwater | Point Vector | GM_WELL_ID, GM_CHEMICAL_NAME, GM_RESULT | Measures 199 contaminants from wells representing 95% of CA groundwater. |
| 15_Crop_Mapping_2023 | Land IQ, CA Dept. of Water Resources | 2024 | Land Use Mapping | Polygon Vector | CROP_TYPE, Shape_Area, MAIN_CROP | 446,000+ field-classified polygons by crop type. |
| BLM Range Allotments | Bureau of Land Management | 2022–24 | BLM Range | Polygon Vector | Shape_Area | Grazing allotments defined spatially in CA. |
| Groundwater Basins (Bulletin 118) | CA Dept. of Water Resources | 2021–22 | i08 B118 | Polygon Vector | FID_Groundwater_basins, Basin_area_Km^2 | Official basin boundaries across CA. |
| Pesticide Use Data | CA Dept. of Pesticide Regulation | 2022 | Pesticide Summary | Polygon Vector | POTASSIUM NITRATE, AMMONIUM NITRATE, etc. | Acres treated & application rates per chemical and county. |
Methods Overview
Our analysis used a series of spatial operations in ArcGIS ModelBuilder and Geoprocessing tools. Key components included land classification, contamination filtering, proximity analysis, and regression modeling.
Part 1: Agricultural Land Area Calculation
We used Select, Intersect, Dissolve, and Field Calculator to calculate the percent area of cropland and ranchland per groundwater basin.
Part 2: Domestic Wells and Land Use
Using Spatial Join, Union, and Clip, we filtered and merged domestic wells with cropland and ranchland overlays to assess shared basin locations.
Part 3: Nitrate and Other Contaminants
Wells were filtered for key contaminants. Nitrate emerged as most significant (EPA MCL >10 mg/L), and wells exceeding this were isolated for further analysis.
Part 4: Proximity Analysis
Used the Near tool to calculate distance (km) from each well to nearest cropland and ranchland, enabling spatial exposure analysis.
Part 5: Pesticide Use Integration
Standardized county names and joined pesticide rates to the well dataset to allow exploration of fertilizer impact on contamination.
Part 6: Linear Regression Analysis
Used OLS (Ordinary Least Squares) to model nitrate concentrations as a function of:
- Percent cropland and ranchland in basin
- Distance to cropland and ranchland
- (Future work) Pesticide application rates
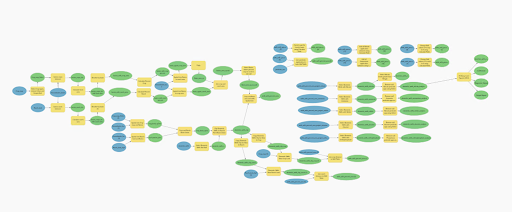
Workflow Diagram